


Anscombe's quartet comprises four datasets that have nearly identical simple statistical properties, yet appear very different when graphed. Each dataset consists of eleven (x,y) points. They were constructed in 1973 by the statistician Francis Anscombe to demonstrate both the importance of graphing data before analyzing it and the effect of outliers on statistical properties.[1]
For all four datasets:
The first scatter plot (top left) appears to be a simple linear relationship, corresponding to two variables correlated and following the assumption of normality. The second graph (top right) is not distributed normally; while an obvious relationship between the two variables can be observed, it is not linear, and the Pearson correlation coefficient is not relevant. In the third graph (bottom left), the distribution is linear, but with a different regression line, which is offset by the one outlier which exerts enough influence to alter the regression line and lower the correlation coefficient from 1 to 0.816. Finally, the fourth graph (bottom right) shows an example when one outlier is enough to produce a high correlation coefficient, even though the relationship between the two variables is not linear.

Four datasets with the same mean x, mean y, variance of x, variance of y, correlation between x and y, and the same linear regression.
But they sure look different when graphed. Moral: always visualize the data points!
http://www.bbc.com/news/magazine-30313326
Too much information.


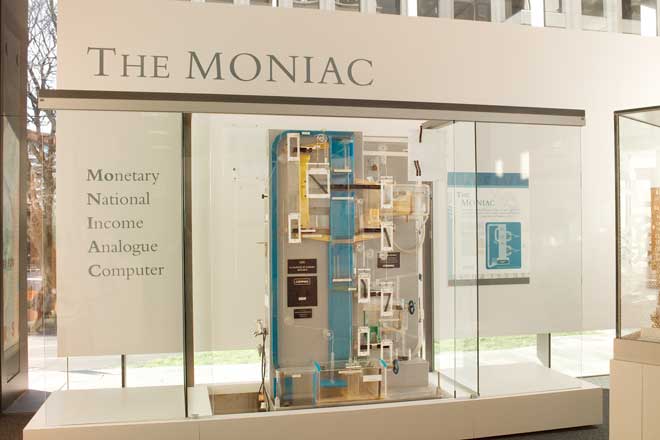
New Zealand engineer Bill Phillips found a unique way to model a national economy in 1949: He used water. Working in his garage, he assembled a conglomeration of tanks, pipes, sluices, and valves into MONIAC, a 7-foot hydraulic computer that modeled the economy of the United Kingdom. Colored water, representing money, is pumped from a bottom reservoir to the top, where it’s distributed among taxes, consumer expenditure, and investment, then finds its way downward through the economy. The user can set “functions” that regulate the effect of national income on tax revenue, government spending on consumption, domestic spending on imports or exports, the interest rate on investment, and the exchange rate on exports and imports.
“To approximate a national economy, a ‘Federal Reserve System’ is added (from a tank through the top U-shaped pump) and bank credit is drawn to expand surplus balances when needed,” notedFortune in a March 1952 feature. “And, if a Keynesian touch is wanted, the government can engage in ‘deficit financing’ by tapping the surplus balances to increase its own expenditures without additional taxation.”
Phillips unveiled the computer at the London School of Economics in 1949 and impressed his audience so much that he was asked to build copies for Harvard, Cambridge, Oxford, the Ford Motor Company and the Central Bank of Guatemala. Unfortunately his invention was soon outmoded by electronic computers, and today only two “Phillips machines” remain: one at Cambridge and the other (above) at the Reserve Bank of New Zealand.